Income Inequality and Economic Stability: How It Could Impact the U.S. Economy in 2026 and Beyond
The widening gap between the wealthy and everyone else poses one of the most pressing threats to America’s economic future. Income inequality has reached levels not seen since the 1920s, and its effects ripple through every aspect of our economy.
This matters now more than ever. As we approach 2026, the concentration of wealth in fewer hands threatens consumer spending, business growth, and social stability across the United States.
Recent data from the Congressional Budget Office shows that the top 1 percent of earners now control more wealth than the entire middle class combined. This shift happened gradually over decades, but its consequences accelerate with each passing year.
What Is This Economic Threat?
Income inequality refers to the uneven distribution of income across a population. When we discuss economic inequality, we examine how wealth and income are shared among different groups within society.
The concept extends beyond simple income distribution. It encompasses wealth inequality, which includes assets like property, investments, and savings. These disparities create a gap between those who own resources and those who work for wages.
Historical patterns show inequality rising and falling throughout American history. The period from 1945 to 1975 saw relatively low inequality levels. Since 1980, however, the trend reversed dramatically.
The United States now ranks among countries with the highest inequality levels in the developed world. The top 10 percent of earners capture approximately 50 percent of all income, while the bottom 50 percent share just 13 percent.
Key statistics paint a stark picture. The median household income has grown by only 17 percent over the past four decades after adjusting for inflation. During the same period, income for the top 1 percent increased by over 200 percent.
Wealth inequality shows even sharper differences. The richest 1 percent of Americans hold about 35 percent of total household wealth. The bottom 50 percent own less than 2 percent combined.
What Is Causing the Problem?
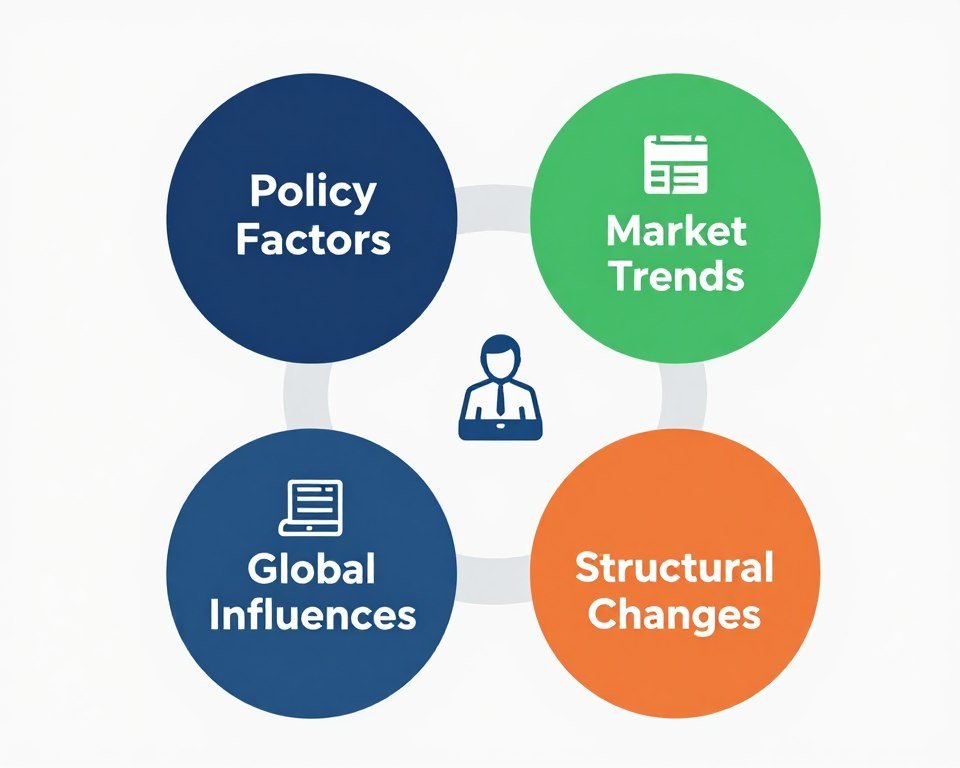
Multiple forces drive the growing income gap in America. Understanding these causes helps explain why inequality persists and grows across time.
Policy Factors
- Tax policy changes since 1980 reduced top marginal rates from 70 percent to current levels below 40 percent
- Minimum wage purchasing power declined by approximately 30 percent since its peak value in 1968
- Labor union membership fell from 35 percent of workers in the 1950s to under 11 percent today
- Financial deregulation enabled greater concentration of wealth in the financial sector
- Social safety net programs failed to keep pace with rising cost of living
Market Trends
- Technology advancement favored high-skill workers while automating middle-skill jobs
- Corporate compensation structures increasingly reward executives with stock options and bonuses
- Housing market dynamics concentrated property wealth in coastal metropolitan areas
- Financial markets grew faster than the overall economy, benefiting asset owners
- Healthcare and education costs rose faster than wages, creating financial barriers
Global Influences
- Trade agreements shifted manufacturing jobs to countries with lower labor costs
- Global competition for talent drove up compensation for highly skilled professionals
- Capital mobility allowed corporations to minimize tax obligations through international structures
- Immigration patterns affected wage levels in certain sectors and regions
- International investment flows concentrated wealth in financial centers
Structural Economic Changes
- Service economy transition reduced opportunities for middle-income manufacturing employment
- Winner-take-all market dynamics rewarded top performers disproportionately
- Educational attainment gaps created persistent income differences across generations
- Geographic concentration of high-paying jobs in specific metropolitan areas
- Declining economic mobility made it harder for people to move between income levels
Impact on the U.S. Economy
Income inequality affects every major component of economic performance. The consequences extend far beyond individual circumstances to shape national economic outcomes.
GDP Growth
Research from the International Monetary Fund demonstrates that high inequality correlates with slower GDP growth over time. Countries with lower inequality levels typically sustain higher growth rates for longer periods.
Consumer spending drives approximately 70 percent of U.S. economic activity. When income concentrates at the top, overall spending declines because wealthy households save a larger portion of their income.
The Congressional Budget Office projects that sustained high inequality could reduce GDP growth by 0.5 to 1.0 percentage points annually. Over decades, this compounds into substantially lower national income.
Inflation
Income inequality influences inflation through multiple channels. Reduced middle-class purchasing power dampens demand for goods and services, creating deflationary pressure in some sectors.
Simultaneously, concentration of wealth drives up prices for luxury goods, assets, and services consumed by high-income households. This creates a two-tier inflation system with different rates across income groups.
Housing markets exemplify this dynamic. Asset price inflation in desirable areas far exceeds general inflation measures, making homeownership increasingly unattainable for average workers.
Employment
Labor market outcomes reflect and reinforce inequality patterns. Job growth increasingly concentrates in high-skill, high-wage positions and low-skill, low-wage service roles.
The Bureau of Labor Statistics reports that middle-wage occupations have declined as a share of total employment. This polarization leaves fewer pathways to middle-class income levels.
Wage growth shows similar patterns. Top earners see consistent real wage increases while median wages stagnate. This divergence accelerated after 2000, creating wider gaps between income groups.
Financial Markets
Stock market performance increasingly disconnects from broader economic conditions. Since equity ownership concentrates among wealthy households, market gains primarily benefit high-income groups.
The Federal Reserve’s research shows that the top 10 percent of households own 89 percent of all stocks. This means stock market growth, while positive for overall wealth statistics, does little for most Americans.
Financial instability risks increase with inequality. The 2008 financial crisis demonstrated how income stagnation combined with easy credit can create dangerous economic vulnerabilities.
Consumers and Businesses
Consumer behavior shifts as inequality grows. Middle and lower-income households reduce discretionary spending, affecting businesses that serve these markets.
Business investment decisions reflect these demand patterns. Companies increasingly target products and services toward affluent consumers, potentially neglecting mass market opportunities.
Small business formation rates decline in high-inequality environments. Concentrated wealth means fewer people have resources to start new ventures, reducing economic dynamism.
Recent Data and Trends
Current data reveals inequality continuing its upward trajectory. The latest figures from multiple authoritative sources confirm this trend shows no signs of reversing without intervention.
The U.S. Department of the Treasury released data showing income concentration reached new highs in recent years. The share of national income going to the top 1 percent hit 20 percent, matching levels last seen before the Great Depression.
Bureau of Labor Statistics wage data demonstrates stagnant median income growth. Real median household income remained essentially flat from 2000 to 2020, despite overall economic growth during much of this period.
Income Distribution by Quintile
The latest Congressional Budget Office analysis breaks down income distribution across population quintiles. Their research reveals widening gaps between each level.
These differences accelerated particularly after 2010. The post-recession recovery disproportionately benefited top earners while middle and lower quintiles saw minimal gains.
| Income Group | Share of Income | Change Since 2000 |
| Top 20% | 52% | +4% |
| Fourth 20% | 23% | -1% |
| Middle 20% | 14% | -2% |
| Second 20% | 8% | -1% |
| Bottom 20% | 3% | 0% |
Wealth inequality statistics from the Federal Reserve paint an even starker picture. Their Survey of Consumer Finances shows the wealth gap growing faster than the income gap.
Net worth for the median household increased only marginally over the past two decades. Meanwhile, households in the 90th percentile saw their net worth more than double during the same time period.
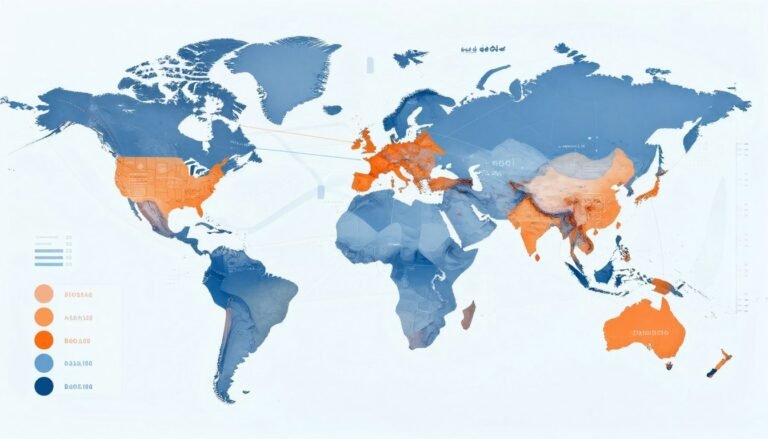
International comparisons place the United States among the most unequal developed countries. Organization for Economic Cooperation and Development data ranks America in the bottom tier for income distribution equality.
Regional differences within the United States add another layer of complexity. Coastal metropolitan areas show extreme inequality levels, while some rural regions maintain more equal distributions at lower overall income levels.
Education-based income gaps widened substantially. Workers with college degrees earn approximately 80 percent more than those with only high school diplomas, up from 40 percent in 1980.
Racial wealth gaps persist at troubling levels. The median white family holds approximately eight times the wealth of the median Black family and five times that of the median Hispanic family.
Gender income gaps, while narrowing, remain significant. Women earn approximately 82 cents for every dollar earned by men when comparing median full-time wages across all occupations.
Age cohort analysis reveals younger generations facing higher inequality than their parents experienced at similar life stages. Millennials and Generation Z confront steeper barriers to wealth accumulation.
Expert Opinions or Forecasts

Leading economists across institutions agree that current inequality trends threaten long-term economic stability. Their projections vary in specifics but converge on the fundamental risks.
International Monetary Fund Projections
IMF economists project that sustained high inequality will reduce potential GDP growth in advanced economies. Their research suggests inequality above certain thresholds creates drag on economic performance.
The organization’s fiscal monitor reports indicate that redistributive policies need not harm growth. In fact, moderate redistribution may support stronger economic performance by boosting aggregate demand.
World Bank Development Perspectives
World Bank researchers emphasize inequality’s role in limiting human capital development. When large portions of the population lack access to quality education and healthcare, overall productivity suffers.
Their development reports highlight how inequality perpetuates across generations. Children born into low-income households face systematic disadvantages that compound throughout their lives.
Federal Reserve Economic Research
Federal Reserve economists study inequality’s effects on monetary policy transmission. Their work shows that concentrated wealth reduces the effectiveness of interest rate adjustments in stimulating broad-based economic activity.
Research from regional Federal Reserve banks documents how geographic inequality concentrates economic dynamism in specific areas while leaving other regions stagnant.
Congressional Budget Office Long-Term Outlook
CBO long-term budget projections incorporate inequality trends into fiscal sustainability analysis. Their models show how inequality affects tax revenue, government spending needs, and overall fiscal health.
The office projects that without policy changes, inequality will continue rising through 2050. This trajectory creates fiscal pressures while simultaneously reducing the tax base’s ability to support needed programs.
Market Outlook
Financial markets may face increased volatility as inequality-driven political tensions rise. Asset concentration creates systemic risks similar to those preceding past financial crises.
Investor expectations increasingly factor inequality into long-term growth projections. Companies serving mass markets face headwinds while luxury-focused businesses may outperform.
Risk Level Assessment
Short-term (2024-2026): MEDIUM
Immediate economic disruption unlikely, but underlying vulnerabilities accumulate.
Medium-term (2027-2030): HIGH
Compound effects of inequality may trigger economic instability without policy intervention.
Long-term (2031+): HIGH
Structural damage to economic growth potential becomes increasingly difficult to reverse.
Prominent economists emphasize that inequality represents a policy choice rather than an inevitable outcome. Nobel laureate Joseph Stiglitz argues that deliberate policy decisions created current conditions and different choices could reverse them.
Former Treasury officials warn that inequality undermines the social cohesion necessary for effective economic policy. When large segments feel left behind, political support for growth-enhancing policies erodes.
Possible Solutions or Policy Responses
Multiple policy approaches could address inequality while supporting overall economic growth. Experts propose various combinations of these interventions based on different economic philosophies.
Government Actions
Tax policy reform represents a primary tool for addressing inequality. Progressive taxation with higher rates on top earners could generate revenue while redistributing resources toward middle and lower-income groups.
Proposals include raising capital gains taxes to match ordinary income rates. Currently, investment income faces lower tax rates than wages, disproportionately benefiting wealthy households.
Minimum wage increases at federal and state levels would directly boost incomes for low-wage workers. Economic research suggests moderate increases produce limited employment effects while significantly improving worker living standards.
Investment in education and training programs could help workers adapt to changing economy demands. Targeted spending on community colleges and vocational training addresses skills gaps.
Universal pre-kindergarten programs would level early childhood development opportunities. Research consistently shows that early education interventions yield high returns through improved lifetime outcomes.
Healthcare reform to reduce costs and expand access would remove a major source of financial insecurity. Medical expenses represent the leading cause of personal bankruptcy in the United States.
Affordable housing initiatives could address rapidly rising housing costs that consume growing shares of household budgets. Increased supply through zoning reform and construction subsidies would moderate price growth.
Federal Reserve Policies
The Federal Reserve faces constraints but possesses some tools relevant to inequality. Their primary mandate focuses on price stability and maximum employment rather than directly addressing distribution.
Monetary policy affects inequality through multiple channels. Sustained low unemployment helps workers, particularly those at lower income levels, through tighter labor markets and faster wage growth.
Asset purchase programs during economic downturns disproportionately benefit wealthy households who own financial assets. Fed officials increasingly acknowledge these distributional consequences.
Research initiatives within the Federal Reserve System study inequality’s effects on economic stability. This analysis informs policy debates even if direct action falls outside the Fed’s mandate.
Market Adjustments
Corporate governance reforms could address executive compensation growth. Shareholders increasingly question pay packages disconnected from broad employee wage trends.
Worker organizing and collective bargaining provide market-based mechanisms for balancing power between labor and capital. Union membership correlates with reduced inequality across countries and time periods.
Antitrust enforcement to limit market concentration may reduce the economic rents that fuel inequality. Dominant firms extract excess profits that flow primarily to owners rather than workers.
Financial regulation to prevent predatory lending and excessive risk-taking protects vulnerable households while promoting stability. The 2008 crisis demonstrated how financial sector abuses compound inequality.
What It Means for Americans

Income inequality affects Americans’ daily lives in concrete ways. Understanding these practical implications helps connect abstract economic concepts to personal circumstances.
Cost of Living
Rising inequality contributes to affordability challenges in key expense categories. Housing costs consume growing shares of household budgets, particularly in metropolitan areas with concentrating economic opportunity.
The median home price relative to median income reached historically high levels. First-time homebuyers face barriers unknown to previous generations, forcing many into extended renting periods.
Healthcare expenses rise faster than wages, creating financial stress even for insured families. High deductible plans shift costs onto households while premiums continue climbing.
Education costs, both for children and continuing adult education, create debt burdens that limit financial flexibility. Student loan balances now exceed $1.7 trillion across the United States.
Childcare costs rival college tuition in many areas, forcing difficult decisions about workforce participation. Families spend 10 to 30 percent of income on childcare depending on location and family structure.
Employment and Jobs
Job quality varies dramatically across the income distribution. High-wage positions offer benefits, security, and advancement opportunities while low-wage work increasingly features irregular schedules and minimal benefits.
The gig economy expands, providing flexibility but lacking traditional protections and benefits. Workers trade security for autonomy, often without fully accounting for long-term costs.
Geographic mobility for employment becomes more difficult as housing costs vary dramatically across regions. Moving to opportunity means facing potentially unaffordable living expenses.
Automation threatens middle-skill jobs while creating demand at the top and bottom of the skill distribution. This polarization narrows pathways to middle-class incomes.
Investments and Savings
Growing numbers of Americans lack emergency savings to handle unexpected expenses. The Federal Reserve reports that 40 percent of adults would struggle to cover a $400 emergency.
Retirement security erodes as traditional pension plans disappear. The shift to 401(k) accounts places investment risk on individuals while concentrating stock market gains among wealthy households.
Social Security faces funding challenges partly driven by wage stagnation and income concentration above the taxable maximum. Benefits may require adjustment without policy intervention.
Access to investment opportunities favors those with existing wealth. Minimum investment requirements and information barriers limit participation by middle and lower-income households.
Housing
Homeownership rates declined, particularly among younger adults. Millennials lag previous generations in homeownership by approximately 10 percentage points at comparable ages.
Rental costs consume larger portions of household income, leaving less for saving and other expenses. The common guideline of spending 30 percent or less on housing becomes unattainable in many markets.
Geographic inequality means housing affordability varies dramatically. Coastal cities with strong job markets face acute shortages while other regions have ample affordable housing but fewer employment opportunities.
Wealth building through homeownership becomes unavailable to those priced out of markets. This perpetuates inequality across generations as housing equity represents the primary wealth source for middle-class families.
Future Outlook (2026–2030)
The trajectory of income inequality over the next several years depends heavily on policy choices and economic conditions. Multiple scenarios remain possible based on different assumptions.
Short-Term Outlook (2026-2027)
Without significant policy intervention, inequality will likely continue its upward trend through the mid-2020s. Current trajectories suggest the gap between top earners and median workers will widen further.
Labor market conditions will play a crucial role. If unemployment remains low, wage pressure may provide some relief for workers. However, historical patterns suggest wage gains concentrate among highly skilled workers even in tight markets.
Political dynamics will shape policy responses. Growing awareness of inequality creates pressure for action, but implementation faces political obstacles. Incremental changes seem more likely than transformative reform in the near term.
Technological change continues disrupting traditional employment patterns. Artificial intelligence and automation may accelerate job displacement in routine occupations while creating opportunities in others.
Housing market pressures show little sign of easing in high-demand metropolitan areas. Supply constraints and zoning restrictions perpetuate affordability challenges for middle-income households.
The Social Security Administration projects trust fund depletion around 2033 without policy changes. This timeline creates urgency for reforms that will necessarily involve distributional choices.
Medium-Term Risks (2028-2030)
Compound effects of sustained inequality may trigger economic instability by the end of the decade. Consumer spending could weaken as middle-class households exhaust borrowing capacity and savings.
Political polarization linked to economic anxiety may intensify, creating governance challenges. Effective economic policymaking requires some level of consensus that becomes harder to achieve.
Financial system vulnerabilities accumulate when inequality reaches high levels. Household debt relative to income approaches concerning thresholds for significant portions of the population.
Regional economic divergence may accelerate as opportunity concentrates in specific metropolitan areas. This geographic inequality creates its own set of economic and social challenges.
Educational attainment gaps could widen further if college costs continue rising faster than middle-income resources. This perpetuates inequality across generations by limiting mobility.
Healthcare system pressures increase as aging population combines with rising costs. Inequality affects both access to care and financial consequences of health problems.
Optimistic Scenario
Policy interventions successfully moderate inequality growth while maintaining economic dynamism. Investments in education and infrastructure create opportunities for broad-based prosperity.
Labor markets remain strong, providing bargaining power for workers. Productivity gains translate into wage growth across the income distribution rather than concentrating at the top.
Housing supply increases through regulatory reform, improving affordability. Technology creates new middle-skill jobs faster than it eliminates existing positions.
Pessimistic Scenario
Policy gridlock prevents meaningful intervention while market forces continue driving divergence. Inequality reaches levels that actively harm overall growth and stability.
Economic recession exposes accumulated vulnerabilities, with recovery following the pattern of primarily benefiting top earners. Social mobility declines further as advantages perpetuate across generations.
Political dysfunction intensifies, making coordinated policy responses increasingly difficult. Regional disparities create economic fragmentation within the national economy.
International comparisons offer perspective on possible futures. Countries like Denmark and Sweden demonstrate that advanced economies can combine prosperity with relatively low inequality through policy choices.
Conversely, emerging economies with high inequality face chronic instability and slower growth. Latin America provides cautionary examples of how extreme inequality undermines development.
The next several years represent a critical period for addressing Income Inequality and Economic Stability. Decisions made now will shape economic outcomes for decades to come.
Conclusion
Income inequality stands as one of the defining economic challenges facing the United States as we approach 2026 and beyond. The concentration of wealth and income in fewer hands threatens consumer spending, business growth, and overall economic stability.
Multiple factors drive this trend, from policy choices to technological change to global economic forces. Understanding these causes helps identify potential solutions ranging from tax reform to education investment to labor market policies.
The stakes extend beyond abstract statistics. Inequality affects Americans’ daily lives through housing affordability, job quality, healthcare access, and economic security. These practical consequences demand attention from policymakers and citizens alike.
Expert consensus suggests that sustained high inequality will drag on economic growth while creating financial instability risks. The medium and long-term outlook depends heavily on whether effective policy responses emerge.
Americans face a choice about the type of economy and society they want to build. The data and analysis presented here demonstrate both the challenges and the possibilities for creating more broadly shared prosperity.
The path forward requires balancing growth with equity, innovation with security, and market dynamism with social cohesion. These goals need not conflict if policies are designed thoughtfully based on evidence.
As we move toward 2030, income inequality will remain a central economic issue shaping policy debates, political outcomes, and individual circumstances. Understanding these dynamics empowers citizens to participate effectively in these crucial conversations.

Continue Your Economic Education
Access comprehensive resources on income inequality, economic policy, and financial stability from leading institutions.
Economic Policy Reports
Download comprehensive analyses from the Congressional Budget Office on income distribution, fiscal policy, and long-term economic projections.
- Annual income inequality reports
- Long-term budget outlooks
- Policy option analyses
International Data Resources
Explore global inequality data and research from the International Monetary Fund and World Bank to understand how U.S. trends compare internationally.
- Cross-country comparisons
- Development economics research
- Policy effectiveness studies
Federal Reserve Research
Access cutting-edge economic research on inequality, wealth distribution, and monetary policy impacts from the Federal Reserve System.
- Survey of Consumer Finances
- Distributional effects analysis
- Regional economic studies