Economic Dependence on Foreign Manufacturing: How It Could Impact the U.S. Economy in 2026 and Beyond
The United States relies on foreign countries for nearly 60 percent of manufactured goods consumed domestically. This level of dependence creates vulnerability in the supply chain that extends beyond individual products to affect the entire economic structure.
Over the past two decades, the manufacturing sector has steadily declined as a share of domestic production. Data from the Bureau Economic Analysis shows manufacturing represented just 10.3 percent of GDP in 2023, down from 16.5 percent in 2000.
Recent disruptions exposed critical weaknesses. When pandemic-related shutdowns affected Asian manufacturing centers, American businesses faced unprecedented shortages of essential goods. The consequences rippled through every sector of the economy, from automotive production to consumer electronics.
This trend carries significant implications for economic stability, national security, and the financial wellbeing of American households. Understanding these dynamics helps businesses and investors prepare for potential disruptions over the next five years.
What Is This Economic Threat?
Economic dependence on foreign manufacturing refers to the structural reliance of the U.S. economy on imported manufactured goods and production inputs from other countries. This dependence manifests across multiple dimensions of the manufacturing sector and supply chain networks.
Historical Development
The shift began in earnest during the 1990s as trade liberalization policies reduced barriers to imports. The average tariff rate fell from 6.4 percent in 1990 to 1.7 percent by 2015, according to World Bank data.
Manufacturing employment peaked at 19.5 million workers in 1979. By 2023, that number had declined to 12.9 million despite population growth of 55 percent during the same period.
China emerged as the dominant supplier during this time. U.S. imports from China increased from $100 billion in 2000 to over $560 billion by 2023, representing roughly 17 percent of all American imports.
Current Scale and Scope
The Bureau Economic Analysis reports that imports of goods totaled $3.2 trillion in 2023. Manufacturing imports accounted for approximately $2.5 trillion of this total, with consumer goods representing the largest category at $840 billion.
| Import Category | 2023 Value (Billions) | Share of Total | Primary Source Countries |
| Consumer Goods | $840 | 26.3% | China, Vietnam, Mexico |
| Industrial Supplies | $710 | 22.2% | Canada, China, Germany |
| Capital Goods | $680 | 21.3% | China, Japan, Germany |
| Automotive | $390 | 12.2% | Mexico, Japan, Canada |
| Other Goods | $580 | 18.1% | Various |
Key Vulnerability Indicators
Several metrics reveal the depth of manufacturing dependence. The import penetration ratio, which measures the share of domestic demand met by imports, reached 31 percent for manufactured goods in 2023.
For specific product categories, this ratio exceeds 80 percent. The consumer electronics industry exemplifies this concentration, with 87 percent of smartphones, 92 percent of laptops, and 78 percent of televisions sold in America produced overseas.
Pharmaceutical inputs present another critical dependency. Approximately 72 percent of active pharmaceutical ingredients used in U.S. drug manufacturing originate from foreign suppliers, primarily in China and India.
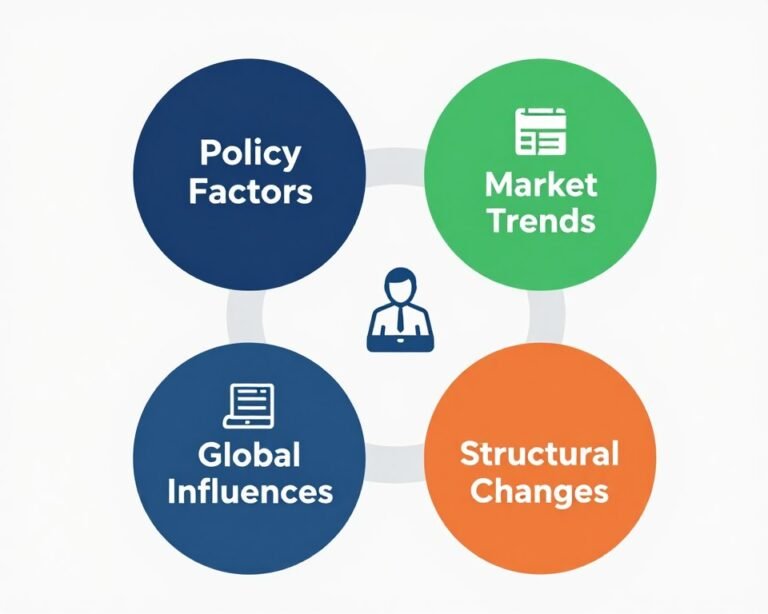
What Is Causing the Problem?
Multiple interconnected factors have driven the shift toward foreign manufacturing over the past three decades. These causes operate across policy, market, and structural dimensions of the economy.
Policy Factors
- Trade Liberalization Agreements: NAFTA implementation in 1994 eliminated tariffs on goods moving between the United States, Canada, and Mexico. China’s 2001 entry into the World Trade Organization reduced trade barriers and granted permanent normal trade relations status.
- Tax Policy Incentives: The tax code historically favored overseas production through provisions allowing deferral of taxes on foreign earnings. Companies could accumulate profits abroad without immediate U.S. tax liability.
- Regulatory Differences: Environmental, labor, and safety regulations impose higher compliance costs on domestic manufacturing. The average cost of regulatory compliance for manufacturers reached $20,000 per employee annually by 2020.
- Currency Policies: Some trading partners maintain undervalued currencies through intervention in foreign exchange markets. This practice effectively subsidizes exports while making imports more expensive for their domestic consumers.
Market Trends
- Labor Cost Differentials: Manufacturing wages in China averaged $3.50 per hour in 2015 compared to $39 per hour in the United States, according to Bureau of Labor Statistics international comparisons. Even as Chinese wages increased, the differential remained substantial.
- Consumer Demand for Low Prices: American consumers prioritize price over origin in purchasing decisions. Surveys consistently show fewer than 25 percent of consumers willing to pay premium prices for domestically manufactured goods.
- Shareholder Value Maximization: Corporate governance emphasizing quarterly earnings growth incentivized cost reduction through offshoring. Manufacturing relocation often produced immediate margin improvements that boosted stock prices.
- Supply Chain Specialization: Concentration of specialized suppliers in foreign manufacturing clusters created network effects. Companies found advantages in locating near established supplier ecosystems.
Global Influences
- Rise of Emerging Market Manufacturing: Countries including China, Vietnam, Bangladesh, and others invested heavily in manufacturing infrastructure and workforce development. Industrial parks offered turnkey solutions for foreign companies.
- Technology Transfer Requirements: Some countries required foreign companies to partner with domestic firms and share technology as conditions for market access. This accelerated capability development in emerging manufacturing centers.
- State-Directed Investment: Government-directed credit allocation and subsidies in several countries supported manufacturing expansion at scales difficult for market-driven economies to match. China’s Made in 2025 initiative exemplifies this approach.
- Global Value Chain Fragmentation: Production processes subdivided into discrete steps performed in different countries based on comparative advantage. This fragmentation increased efficiency but created dependency on multiple foreign nodes.
Structural Economic Changes
- Automation and Skill Requirements: Advanced manufacturing increasingly required specialized skills. The education system struggled to produce sufficient numbers of workers with technical training in fields like industrial automation and precision machining.
- Capital Investment Patterns: Domestic manufacturing investment declined as companies directed capital toward technology, services, and financial engineering. Manufacturing investment as a share of business fixed investment fell from 31 percent in 1980 to 18 percent by 2020.
- Real Estate Cost Pressures: Industrial land prices in U.S. metro areas increased faster than inflation. Manufacturers faced pressure to convert valuable urban industrial sites to higher-value uses like residential or commercial development.
- Energy Cost Volatility: While the shale revolution reduced energy costs after 2010, earlier periods of high and volatile energy prices made energy-intensive manufacturing less competitive domestically compared to countries with subsidized energy sectors.
Impact on the U.S. Economy
The concentration of manufacturing in foreign countries affects multiple dimensions of domestic economic performance. These impacts compound over time as the industrial base erodes and dependencies deepen.
GDP Growth
Manufacturing dependence constrains GDP growth through multiple channels. The trade deficit in goods reached $1.2 trillion in 2023, subtracting approximately 5.3 percent from calculated GDP.
The Congressional Budget Office estimates that each $100 billion in reduced manufacturing output corresponds to roughly $160 billion in total economic impact when accounting for multiplier effects through supply chains and consumer spending.
Domestic manufacturing generates higher multiplier effects than service industries. Each dollar of manufacturing output creates an additional $1.48 in economic activity, compared to $0.78 for services, according to the Bureau Economic Analysis input-output tables.
The reduction in manufacturing capacity limits potential growth rates. Economic models suggest manufacturing dependence has reduced the economy’s sustainable growth rate by approximately 0.3 to 0.5 percentage points annually since 2000.
Inflation
Supply chain vulnerabilities created by foreign dependence contribute to price instability. When disruptions affect key manufacturing centers, constrained supply drives rapid price increases across affected product categories.
The pandemic period illustrated this dynamic clearly. Consumer price inflation for durable goods, which are predominantly imported, increased 18.7 percent between February 2020 and December 2022. Services inflation rose just 11.2 percent during the same period.
Transportation cost volatility amplifies inflation effects. Ocean freight rates for a standard container from Asia to the U.S. West Coast fluctuated from $1,500 in early 2020 to over $20,000 in late 2021, then back to $2,000 by late 2023.
Currency fluctuations create additional inflationary pressure. A 10 percent depreciation in the dollar typically increases import prices by approximately 4 percent within six months, according to Federal Reserve research.
Employment
The manufacturing sector has lost 7.5 million jobs since peak employment in 1979. The Bureau of Labor Statistics reports manufacturing employment at 12.9 million in 2023, representing 8.3 percent of total nonfarm employment.
Job quality differences between manufacturing and replacement employment affect household economics. Average manufacturing wages reached $69,000 annually in 2023, compared to $56,000 for all private sector workers.
Geographic concentration of job losses created regional economic distress. Counties with high manufacturing employment concentration in 2000 experienced average income declines of 11 percent by 2023 after adjusting for inflation.
The skills mismatch worsened as manufacturing jobs disappeared faster than workers could retrain. Labor force participation rates fell most sharply among prime-age workers in manufacturing-dependent communities.
Manufacturing Employment Trends
Manufacturing sector employment peaked in 1979 and declined steadily through 2023. The rate of decline accelerated after 2000 as trade liberalization expanded.
Even during economic expansions, manufacturing employment recovered only partially. The 2009-2019 expansion added just 1.3 million manufacturing jobs compared to 22.8 million total job gains.
Financial Markets
Foreign manufacturing dependence introduces volatility into financial markets through supply chain risk channels. Equity valuations for companies with concentrated overseas exposure experience greater volatility during geopolitical tensions or trade policy changes.
The average daily trading range for stocks in sectors with high import dependence increased by 23 percent during trade policy uncertainty periods between 2018 and 2023 compared to lower-dependency sectors.
Corporate earnings face pressure from multiple sources. Currency movements affect overseas production costs. Tariff implementation creates margin compression. Supply disruptions force production stoppages that impact quarterly results.
Bond markets reflect country risk associated with manufacturing concentration. Corporate bonds for companies with significant China exposure traded at spreads averaging 35 basis points higher than comparable domestic-focused companies during 2022-2023.
Consumers and Businesses
Consumer goods prices remain artificially suppressed through low-cost imports, but this dynamic creates vulnerability. Any disruption to supply chains produces rapid price increases that outpace wage growth.
Product availability suffers during supply chain stress. The pandemic period saw inventory-to-sales ratios for retail goods fall to 1.08 months in early 2021, well below the historical average of 1.45 months. Shortages affected everything from appliances to automobiles.
Businesses face operational challenges from extended supply chains. Lead times for imported inputs increased from an average of 45 days in 2019 to 78 days in 2021, forcing companies to hold excess inventory that tied up working capital.
Small and medium businesses lack the scale to manage complex international supply chains effectively. They face higher costs and greater vulnerability compared to large corporations with sophisticated supply chain management capabilities and bargaining power.
Recent Data and Trends
Current economic data reveals accelerating shifts in manufacturing patterns and trade relationships. Multiple indicators show both the persistence of foreign dependence and early signs of potential restructuring.
Trade Balance Trends
The goods trade deficit reached $1.18 trillion in 2023, an increase of 4.2 percent from 2022. This figure represents the second-highest deficit on record after adjustment for inflation.
Import volume growth exceeded export growth across most manufacturing categories. Imports of goods increased 5.7 percent year-over-year while exports grew just 2.1 percent during the same period.
The International Monetary Fund data shows the U.S. share of global merchandise exports continued declining, falling from 8.6 percent in 2020 to 7.9 percent in 2023. Meanwhile, the U.S. share of global imports remained elevated at 13.4 percent.
Manufacturing Sector Performance
Domestic manufacturing output increased 1.8 percent in 2023 according to Bureau Economic Analysis data. However, this growth rate lagged overall GDP growth of 2.5 percent, causing manufacturing’s share of the economy to decline further.
Capacity utilization in manufacturing averaged 78.2 percent in 2023, below the long-term average of 79.8 percent. This indicates existing domestic facilities operate below optimal levels while demand is met through imports.
The Institute for Supply Management manufacturing index averaged 48.7 in 2023, indicating contraction in the sector for most of the year. Values below 50 signal declining activity.
Supply Chain Evolution
Companies announced 364,000 manufacturing jobs through reshoring and foreign direct investment initiatives in 2023, according to the Reshoring Initiative. This represents a 75 percent increase compared to the 2019 level of 208,000 jobs.
These announcements concentrate in specific sectors. Semiconductor manufacturing, electric vehicle production, and battery manufacturing account for 63 percent of announced reshoring jobs.
However, actual employment gains lag announcements significantly. Manufacturing employment increased by only 43,000 jobs in 2023, suggesting many announced projects face implementation delays or cancellations.
| Supply Chain Metric | 2019 | 2021 | 2023 | Trend |
| Average Lead Time (days) | 45 | 78 | 62 | Improving |
| Container Shipping Cost Index | 100 | 1,267 | 133 | Normalized |
| Inventory-to-Sales Ratio | 1.45 | 1.08 | 1.52 | Above Average |
| Supplier Delivery Time Index | 51.2 | 72.8 | 48.6 | Faster |
Import Source Diversification
Trade patterns show gradual diversification away from China, though the country remains the dominant supplier. U.S. imports from China totaled $562 billion in 2023, down from a peak of $580 billion in 2022 but still representing 17.1 percent of total imports.
Vietnam emerged as a significant alternative source, with imports increasing from $62 billion in 2019 to $115 billion in 2023. This 85 percent increase reflects companies shifting production to reduce China concentration.
Mexico benefited substantially from nearshoring trends. Imports from Mexico reached $498 billion in 2023, making it the largest single-country source and surpassing China for the first time since 2008.
Tariff Impact Data
Tariffs implemented since 2018 remain largely in place, affecting approximately $370 billion in annual imports. The average tariff rate on Chinese goods increased from 3.1 percent in 2017 to 19.3 percent in 2023.
Academic research published by the National Bureau of Economic Research estimated these tariffs reduced GDP by 0.3 percent while increasing consumer prices for affected goods by an average of 8.7 percent through 2023.
Companies absorbed some tariff costs through margin compression rather than full price pass-through. Import prices increased by only 4.2 percent despite tariffs averaging 19.3 percent, indicating importers and retailers accepted lower profits to maintain market share.
Investment Patterns
Foreign direct investment in U.S. manufacturing facilities reached $158 billion in 2023, the highest level since 2016. The CHIPS Act and Inflation Reduction Act subsidies drove much of this increase through incentives for semiconductor and clean energy manufacturing.
Domestic manufacturing construction spending surged to $189 billion in 2023, double the 2021 level. However, this spending concentrates heavily in subsidized sectors, with computer and electronic products accounting for 48 percent of the total.
Private sector research and development investment in manufacturing technologies increased 11 percent in 2023. Companies prioritize automation and productivity improvements that reduce labor requirements rather than labor-intensive production reshoring.
Expert Opinions or Forecasts
Economic analysts project that foreign manufacturing dependence will remain elevated through 2026 while gradual restructuring occurs in specific sectors. Expert consensus identifies both risks and opportunities in this transition period.
Congressional Budget Office Projections
The Congressional Budget Office forecasts the goods trade deficit will remain above $1.1 trillion annually through 2028. Their models project manufacturing as a share of GDP will stabilize near 10 percent rather than decline further, representing a shift from the downward trend of previous decades.
CBO economists expect modest GDP growth averaging 2.1 percent annually from 2024 through 2028. They note manufacturing sector growth will slightly exceed this average at 2.4 percent, driven by policy incentives in semiconductors and clean energy.
“While we anticipate some reshoring in strategic industries, the fundamental economics of global manufacturing will keep the majority of production overseas through 2030. The costs and timelines for rebuilding domestic capacity exceed what most companies can justify.”
International Monetary Fund Assessment
The International Monetary Fund characterizes global supply chain restructuring as a multi-decade process rather than a rapid shift. Their analysis suggests manufacturing networks established over 30 years cannot relocate quickly without severe economic disruption.
IMF economists project global trade growth will average 3.1 percent annually through 2028, below the 4.5 percent average from 1990 to 2020. This slower growth reflects trade fragmentation as countries prioritize supply chain security over pure efficiency.
Currency implications feature prominently in IMF analysis. They forecast the dollar will remain 5 to 8 percent overvalued through 2026, making U.S. manufacturing less competitive and perpetuating trade imbalances.
Federal Reserve Bank Research
Federal Reserve economists studying supply chain resilience note that diversification, not reshoring, characterizes most corporate strategies. Their surveys show 68 percent of companies plan to diversify suppliers across multiple countries while only 23 percent intend significant U.S. production increases.
Fed research indicates tariffs alone prove insufficient to drive large-scale manufacturing return. Companies require sustained policy support including subsidies, regulatory streamlining, and workforce development to make domestic production economically viable.
Labor market analysis from Federal Reserve Banks highlights a critical constraint. The manufacturing sector needs approximately 3.8 million additional workers by 2030 to meet projected domestic production targets, but demographic trends and education patterns suggest only 1.4 million will be available.
Private Sector Economist Views
Major financial institutions project continued but slower growth in imports. Goldman Sachs forecasts import growth averaging 3.8 percent annually through 2027, compared to 4.9 percent over the previous decade.
Manufacturing consultancies identify automation as the primary driver of any significant reshoring. Boston Consulting Group estimates only highly automated facilities can compete with low-cost labor markets, requiring capital investment averaging $650,000 per manufacturing job created.
Supply chain experts emphasize the “China Plus One” strategy dominating corporate planning. Rather than eliminating China exposure, companies add alternative suppliers in Vietnam, India, and Mexico while maintaining Chinese operations for scale and efficiency.
Academic Research Perspectives
University economists studying industrial policy effectiveness express skepticism about large-scale manufacturing restoration. Research from the Massachusetts Institute of Technology suggests successful advanced manufacturing requires ecosystem development including specialized suppliers, skilled labor, and supporting industries that take 15 to 25 years to establish.
Academic analysis of the CHIPS Act and similar policies notes that subsidies address capital costs but not the ongoing operational cost disadvantages. One study estimates domestic semiconductor manufacturing costs remain 25 to 40 percent higher than Asian alternatives even after accounting for subsidy value.
Industry-Specific Outlooks
Semiconductor industry analysts project significant capacity additions domestically, with U.S. share of global production potentially increasing from 12 percent in 2023 to 18 percent by 2030. However, this still leaves 82 percent of production overseas.
Automotive sector forecasts indicate electric vehicle manufacturing may prove more amenable to domestic production than traditional vehicles. Battery supply chain development receives substantial policy support, though mineral processing remains concentrated in China.
Consumer goods manufacturing shows little prospect for major reshoring. Cost differentials remain too large for labor-intensive products like apparel, furniture, and household goods to return to domestic production at scale.
Risk Level Assessment
Expert consensus places the overall risk level at Medium-High for the 2024-2026 period. While catastrophic supply chain collapse remains unlikely, elevated vulnerability to disruptions persists. The greatest risks concentrate in industries with single-country dependencies and limited domestic production capability.
Possible Solutions or Policy Responses
Addressing foreign manufacturing dependence requires coordinated policy interventions across multiple domains. Economists and policy analysts have proposed various approaches, though implementation faces significant political and economic obstacles.
Government Actions
Industrial Policy and Subsidies
The CHIPS and Science Act allocated $52 billion for semiconductor manufacturing and research. Early results show 23 major facility announcements representing $230 billion in private investment, though actual construction and production remain years away.
The Inflation Reduction Act provides $369 billion in clean energy incentives, including substantial manufacturing tax credits. These credits reach 30 percent of capital investment for facilities meeting domestic content requirements.
Additional proposals under consideration include expanded manufacturing tax credits applicable to broader sectors beyond semiconductors and clean energy. The American Manufacturing Innovation Act would provide 20 percent tax credits for advanced manufacturing facility construction.
Trade Policy Adjustments
Tariff policy remains controversial among economists. Some advocate maintaining current tariffs to protect domestic industries during rebuilding. Others argue tariffs simply increase consumer costs without generating meaningful production shifts.
The U.S. Department of the Treasury has proposed modernizing trade enforcement mechanisms to address currency manipulation and subsidies more effectively. Current rules date to trade agreements negotiated in the 1990s and fail to capture contemporary practices.
Supply chain security provisions in trade agreements represent a newer approach. The USMCA includes requirements for higher North American content in automobiles, forcing companies to source more inputs domestically or from regional partners.
Workforce Development Initiatives
The Department of Labor expanded apprenticeship programs targeting manufacturing skills. Registered apprenticeships in manufacturing occupations increased 34 percent between 2020 and 2023, though absolute numbers remain modest at 87,000 participants.
Community college partnerships with manufacturers have grown substantially. These programs provide industry-specific training aligned with local employer needs. However, funding constraints limit scale, with programs reaching only 12 percent of the potential student population.
Immigration policy reforms could address labor shortages. Proposals include expanding skilled worker visa categories and creating pathways for manufacturing workers. Political obstacles have prevented enactment of comprehensive immigration reform.
Federal Reserve Policies
The Federal Reserve’s primary tool, interest rate policy, affects manufacturing investment decisions indirectly through capital costs. Higher interest rates increase the cost of financing manufacturing facility construction and equipment purchases.
During the 2022-2023 rate increase cycle, manufacturing construction actually accelerated due to policy subsidies offsetting higher financing costs. This unusual pattern suggests subsidies can overcome monetary policy headwinds when sufficiently generous.
Exchange rate policy represents another potential lever, though the Fed does not actively manage currency values. Some economists advocate a weaker dollar policy to improve manufacturing competitiveness, but this conflicts with the dollar’s role as global reserve currency.
Financial stability considerations also matter. Fed research indicates rapid supply chain restructuring could strain corporate balance sheets and banking sector loan portfolios, requiring careful monitoring to prevent financial disruptions.
Market Adjustments
Corporate Strategy Evolution
Companies are implementing supply chain resilience strategies without policy mandates. These market-driven responses include supplier diversification, increased inventory buffers, and nearshoring to Mexico and Canada.
The total cost of ownership calculation has shifted to incorporate risk factors beyond direct labor and material costs. Supply chain disruptions during the pandemic demonstrated that lowest-cost sourcing may not minimize total costs when delays and volatility are factored in.
Automation investment accelerated as labor cost advantages of offshore production diminished. The adoption rate of industrial robots in U.S. manufacturing increased 28 percent between 2020 and 2023, reducing labor requirements and making domestic production more viable.
Consumer Behavior Changes
Surveys indicate growing consumer willingness to pay modest premiums for domestically manufactured goods. Research shows 42 percent of consumers would pay 5 to 10 percent more for American-made products, up from 31 percent in 2019.
However, actual purchasing behavior often diverges from stated preferences. Point-of-sale data reveals price remains the dominant factor, with most consumers choosing lower-cost imported alternatives when faced with real purchasing decisions.
Financial Market Incentives
Investors increasingly incorporate supply chain risk into valuations. Companies with diversified supply chains trade at premium multiples compared to those with concentrated dependencies, creating market incentives for risk reduction.
Environmental, social, and governance investment criteria now commonly include supply chain factors. Large institutional investors pressure companies to demonstrate supply chain resilience and transparency as part of risk management frameworks.
Short-term Policy Priorities
- Accelerate CHIPS Act facility construction and production
- Expand workforce training program funding and access
- Streamline permitting for manufacturing construction projects
- Enhance supply chain monitoring and early warning systems
- Coordinate with allies on critical supply chain security
Long-term Structural Reforms
- Comprehensive manufacturing tax reform favoring domestic investment
- Infrastructure modernization supporting manufacturing logistics
- Education system alignment with manufacturing skill requirements
- Research and development support for advanced manufacturing
- Trade policy framework addressing 21st century challenges
Implementation Challenges
Policy effectiveness faces significant obstacles. The time lag between policy enactment and tangible results tests political patience. Manufacturing facilities require three to five years from announcement to production, creating disconnect between policy action and visible outcomes.
Cost remains a fundamental barrier. The Congressional Budget Office estimates full elimination of the manufacturing trade deficit would require government support exceeding $200 billion annually, politically unviable in the current fiscal environment.
Global retaliation poses risks. Trading partners have responded to U.S. tariffs and subsidies with their own protectionist measures. The World Trade Organization has ruled several U.S. policies inconsistent with trade agreements, though enforcement mechanisms remain weak.
Market distortions from subsidies create inefficiencies. Resources flow to politically favored sectors rather than those with genuine comparative advantage. Economic modeling suggests subsidy-driven manufacturing expansion reduces overall productivity and living standards compared to market-driven allocation.
What It Means for Americans
Foreign manufacturing dependence affects American households through multiple channels that extend beyond abstract economic statistics. These impacts touch daily life in concrete ways that vary by income level, employment sector, and geographic location.
Cost of Living
Consumer goods prices remain lower than they would be with domestic production, providing immediate benefit to household budgets. The typical American household saves an estimated $850 annually through access to lower-cost imported goods compared to domestic alternatives.
However, price volatility increased substantially. During supply chain disruptions, prices for imported goods can spike rapidly. Appliance prices increased 23 percent between January 2021 and July 2022, far exceeding typical inflation rates.
The distribution of costs and benefits varies significantly by income level. Lower-income households spend higher shares of income on tradeable goods and benefit more from low import prices. Upper-income households face less exposure to import price changes given their spending patterns.
Housing costs connect to manufacturing through materials supply chains. Construction materials including lumber, steel, and fixtures are increasingly imported. Disruptions to these supply chains contributed to housing cost increases, with new home prices rising 47 percent from 2019 to 2023.
Sector-Specific Price Impacts
| Product Category | Import Share | Price Change 2019-2023 | Volatility Level |
| Electronics | 87% | +12% | High |
| Apparel | 94% | +18% | Medium |
| Furniture | 68% | +31% | High |
| Appliances | 72% | +23% | Very High |
| Toys | 85% | +15% | Medium |
Jobs
The manufacturing sector employed 12.9 million workers in 2023, down from 17.3 million in 2000. Each lost manufacturing job affects not just the displaced worker but entire communities built around manufacturing employment.
Wage effects extend beyond manufacturing workers. Research shows manufacturing employment concentration in a region boosts wages across all sectors. A 10 percent decline in regional manufacturing employment corresponds to average wage reductions of 3.2 percent even for non-manufacturing workers.
Career pathways narrowed significantly. Manufacturing historically provided middle-class wages for workers without college degrees. The decline of these opportunities contributed to stagnant wage growth for workers with high school education or less.
Geographic concentration of job losses created regional economic decline. The Midwest and Southeast experienced the most severe impacts. Counties with manufacturing employment above 20 percent of total employment in 2000 saw median household incomes decline 8 percent in real terms by 2023.
Employment Alternatives and Wage Comparison
Workers displaced from manufacturing face limited comparable alternatives. Service sector jobs that absorbed former manufacturing workers typically pay 27 percent less than manufacturing positions with similar skill requirements.
The Bureau of Labor Statistics data shows median manufacturing wages reached $69,000 in 2023. Displaced workers finding employment in retail earn median wages of $32,000. Those moving to hospitality earn $28,000 on average.
Benefits erosion compounds wage differences. Manufacturing jobs offer health insurance coverage at 89 percent rates compared to 67 percent in retail and 44 percent in hospitality. Retirement plan access follows similar patterns.
Investments
Investment portfolios face elevated volatility from supply chain risks. Equity holdings in manufacturing-dependent sectors experience greater price swings during trade policy changes or geopolitical tensions.
The technology sector, which represents 28 percent of the S&P 500 by market capitalization, faces particular exposure. Most technology hardware relies on Asian manufacturing, creating vulnerability to disruptions. During 2022, technology stocks declined 28 percent compared to 18 percent for the broader market, with supply chain concerns contributing significantly.
Bond investments also reflect manufacturing dependence risks. Corporate bonds for companies with concentrated overseas exposure trade at wider spreads, reducing returns for bondholders. Municipal bonds in manufacturing-dependent regions face higher default risk as the tax base erodes.
Retirement account balances suffered during supply chain disruption periods. The average 401(k) balance declined 23 percent in 2022, with supply chain pressures contributing to both inflation and stock market declines that eroded savings.
Portfolio Diversification Considerations
Financial advisors increasingly recommend supply chain risk assessment when constructing portfolios. Companies with diversified supply chains and domestic production capacity offer potential downside protection during disruption periods.
Sectors with lower import dependence, including services, domestic-focused retail, and utilities, provide portfolio stability. These holdings underperformed during the 2010-2020 period when globalization benefited import-dependent sectors but offered better risk-adjusted returns in the 2020-2023 period.
Housing
Housing affordability connects directly to manufacturing dependence through construction materials and appliance supply chains. New home construction costs increased 42 percent from 2019 to 2023, with imported materials accounting for approximately 60 percent of the increase.
The National Association of Home Builders estimates supply chain disruptions added an average of $36,000 to new home prices during 2021-2022. While costs moderated in 2023, they remained 28 percent above 2019 levels even after adjusting for typical inflation.
Housing availability suffered as construction slowed during material shortages. The inventory of new homes for sale fell to historic lows of 2.9 months of supply in early 2022, well below the balanced market level of 6 months.
Renovation and maintenance costs increased similarly. Homeowners faced price increases of 35 percent for projects requiring imported materials like appliances, fixtures, and flooring. This eroded home equity values by increasing the cost of necessary improvements.
Regional Housing Market Variations
Manufacturing-dependent regions face unique housing challenges. As manufacturing employment declined, housing values in affected areas stagnated or fell. The median home price in manufacturing-concentrated counties increased just 18 percent from 2000 to 2023 compared to 94 percent nationally.
This geographic divergence trapped residents with underwater mortgages or homes worth less than replacement cost in declining markets. Mobility decreased as workers could not sell homes to pursue opportunities elsewhere, perpetuating regional economic decline.
Practical Impact Summary
For the median American household earning $74,000 annually, foreign manufacturing dependence manifests as:
- Annual savings of $850 on consumer goods versus domestic production
- Increased price volatility adding $420 in unexpected costs during disruption periods
- Higher risk of job displacement or wage stagnation if employed in vulnerable sectors
- Investment portfolio volatility averaging 2.3 percentage points higher for standard holdings
- Housing costs elevated by $36,000 for new home purchases or $8,400 for major renovations
The net effect varies substantially based on individual circumstances, employment sector, and geographic location.
Future Outlook (2026-2030)
The trajectory of foreign manufacturing dependence over the next five years will be shaped by policy implementation, corporate strategies, and global economic conditions. Multiple scenarios are possible, with outcomes depending on decisions made in both public and private sectors.
Short-Term Outlook (2026-2027)
The manufacturing sector will likely experience modest growth averaging 2.2 to 2.8 percent annually through 2027. This rate exceeds the previous decade’s performance but falls short of levels needed to significantly reduce foreign dependence.
Policy-driven investment in semiconductors and clean energy manufacturing will begin producing tangible output. The first major semiconductor fabrication facilities funded through the CHIPS Act are scheduled to begin production in late 2025 and early 2026, adding domestic capacity gradually.
However, the broader manufacturing sector faces continued challenges. The trade deficit in goods will likely remain above $1 trillion annually. Import growth will moderate to 3.5 to 4.2 percent per year, slower than the previous decade but still exceeding export growth.
Supply Chain Evolution
Companies will continue diversifying away from single-country dependencies. Mexico’s share of U.S. imports is projected to increase from 15.6 percent in 2023 to approximately 18 percent by 2027. Vietnam, India, and other Southeast Asian countries will also gain market share at China’s expense.
This diversification represents supply chain risk management rather than fundamental reduction in import dependence. Total import levels will continue rising even as individual country concentrations decline.
Nearshoring to Mexico and Canada will accelerate in sectors where transportation costs or time-to-market considerations favor proximity. Automotive, heavy machinery, and certain consumer goods categories will see the most significant shifts.
Labor Market Dynamics
Manufacturing employment is projected to remain relatively stable, increasing by 100,000 to 250,000 jobs through 2027. This modest growth reflects two offsetting forces: policy-driven facility construction adding jobs while automation reduces labor requirements per unit of output.
The skills gap will worsen before improving. Retirements will remove experienced workers faster than training programs can develop replacements. The industry faces a projected shortage of 1.9 million workers by 2027 according to industry associations.
Wage pressure will intensify as companies compete for limited skilled labor. Manufacturing wages are expected to grow 4.2 to 4.8 percent annually, exceeding overall wage growth and potentially making domestic production more competitive as foreign wages also rise.
Long-Term Risks (2028-2030)
The period from 2028 to 2030 presents elevated uncertainty as several long-term trends reach critical inflection points. Multiple risk factors could either reinforce continued foreign dependence or trigger more rapid restructuring.
Geopolitical Risk Scenarios
Rising tensions between major powers pose the most significant risk to supply chain stability. Conflict or severe diplomatic breakdown could force rapid supply chain restructuring under crisis conditions, causing economic disruption and inflation.
Taiwan represents a particular vulnerability given its dominance in advanced semiconductor manufacturing. The island produces 92 percent of the world’s most advanced chips. Any military conflict would immediately create severe shortages with no short-term alternatives.
Trade policy remains uncertain beyond 2026. Different political leadership could either reverse current industrial policy initiatives or expand them substantially. This uncertainty complicates long-term corporate planning and investment decisions.
Technology Disruption Potential
Advanced manufacturing technologies could fundamentally alter economics of production location. Significant developments in several areas could accelerate or reverse current trends.
Artificial intelligence and robotics may reduce labor cost advantages of offshore production. If automation reaches a level where labor represents less than 15 percent of production costs, proximity to end markets and intellectual property protection could favor domestic production.
Additive manufacturing at commercial scale could enable distributed production models. Rather than centralized factories, products might be manufactured near consumers using digital designs, fundamentally restructuring supply chains.
Conversely, continued foreign leadership in manufacturing technology could make competing with overseas producers increasingly difficult. China’s investments in advanced manufacturing technologies may create capabilities that cement production leadership regardless of labor costs.
Climate and Energy Considerations
Climate change impacts on supply chains will intensify. More frequent extreme weather events could disrupt overseas manufacturing centers and shipping routes with increasing severity. Companies may prioritize supply chain resilience over efficiency.
Energy transitions affect manufacturing competitiveness. Countries with low-cost clean energy will gain advantages in energy-intensive manufacturing. The U.S. renewable energy cost declines could improve competitiveness in sectors like steel, chemicals, and aluminum.
Carbon border adjustments under consideration in several countries would change trade economics. If implemented, these policies would add costs to imports from high-carbon manufacturing systems, potentially encouraging domestic production or sourcing from low-carbon suppliers.
Demographic Constraints
Aging populations in the United States and other developed countries will constrain manufacturing workforce availability. The Bureau of Labor Statistics projects labor force growth of just 0.4 percent annually from 2026 to 2030, creating competition for workers across sectors.
Immigration policy will critically impact manufacturing labor supply. Current restrictive policies limit access to foreign workers even as domestic labor availability declines. More open immigration could ease workforce constraints.
Educational pipeline challenges persist. Only 28 percent of U.S. students graduate with skills relevant to advanced manufacturing. Competing countries invest more heavily in technical education, creating long-term competitive disadvantages.
Most Likely Scenario
Based on current trends and policy trajectories, the most probable outcome involves gradual diversification without dramatic reductions in overall import dependence through 2030.
Manufacturing will likely represent 10.5 to 11.2 percent of GDP by 2030, a modest increase from 10.3 percent in 2023. This stabilization would reverse decades of decline but fall far short of historical levels above 15 percent.
The goods trade deficit is projected to stabilize between $1.0 and $1.2 trillion annually. Import growth will slow to match domestic consumption growth more closely, but the fundamental imbalance will persist.
Employment in manufacturing could reach 13.4 to 13.8 million by 2030, an increase of 500,000 to 900,000 jobs from current levels. This growth would be concentrated in advanced manufacturing sectors supported by policy incentives.
Supply chains will become more geographically dispersed but not dramatically shorter. Companies will maintain overseas production while reducing single-country dependencies through diversification strategies.
Critical Uncertainties
Several factors could significantly alter this baseline projection:
- Major geopolitical crisis: Could force rapid restructuring under emergency conditions
- Breakthrough manufacturing technologies: Could fundamentally change production economics
- Sustained policy commitment: Consistent support beyond political cycles is uncertain
- Global recession: Could derail investment in new domestic capacity
- Climate disruptions: May force supply chain restructuring faster than currently anticipated
The next five years represent a transition period where initial policy interventions begin showing results while fundamental economic forces continue driving overseas production. The outcome will determine whether current trends represent a temporary adjustment or lasting restructuring of manufacturing geography.
Conclusion
Economic dependence on foreign manufacturing represents one of the defining structural challenges facing the United States economy through 2026 and beyond. The current level of import reliance, with foreign sources providing 60 percent of manufactured goods, creates vulnerability that extends across supply chains, employment, and economic stability.
The analysis reveals several key takeaways that should inform both policy decisions and business strategies moving forward.
First, the scale of dependence makes rapid change unlikely. Manufacturing networks developed over three decades cannot relocate quickly without severe economic disruption. Projections suggest manufacturing will represent only 10.5 to 11.2 percent of GDP by 2030, a modest improvement from current levels but far below historical norms.
Second, policy interventions can influence outcomes at the margins but face fundamental economic constraints. The CHIPS Act and similar initiatives will add domestic capacity in strategic sectors, but broader manufacturing restoration requires sustained commitment measured in decades rather than years.
Third, supply chain diversification rather than wholesale reshoring characterizes most corporate responses. Companies are reducing single-country dependencies, particularly exposure to China, while maintaining overseas production for economic efficiency. Mexico, Vietnam, and India benefit from this reallocation.
Fourth, the impacts on American households are tangible and immediate. While import dependence keeps consumer goods prices lower, it creates price volatility during disruptions and contributes to wage stagnation for workers without college degrees through manufacturing job losses.
Fifth, multiple risk factors could force faster restructuring than current baseline projections suggest. Geopolitical tensions, particularly involving Taiwan and semiconductor supply chains, pose significant near-term risks. Climate disruptions and technology breakthroughs represent longer-term wildcards.
Looking Forward
The period from 2026 through 2030 will test whether current policy initiatives can begin reversing decades of manufacturing decline or merely slow the rate of deterioration. Success requires coordination across multiple policy domains including trade, tax, workforce development, and infrastructure investment.
For businesses, the imperative is clear: supply chain resilience must become a strategic priority alongside cost efficiency. Diversification, nearshoring where economically viable, and increased inventory buffers all carry costs but provide insurance against disruption risks that have become more frequent and severe.
For investors, manufacturing dependence creates both risks and opportunities. Companies with diversified supply chains and domestic production capabilities may offer better risk-adjusted returns than those with concentrated foreign exposure. Policy-supported sectors like semiconductors and clean energy manufacturing warrant attention despite elevated valuations.
For policymakers, the challenge lies in sustaining commitment beyond election cycles and budget pressures. Manufacturing restoration requires patient capital and consistent policy frameworks that allow businesses to make long-term investment decisions with confidence.
The United States will remain substantially dependent on foreign manufacturing through 2030 under any realistic scenario. However, the actions taken now will determine whether this dependence gradually diminishes or continues deepening. The stakes extend beyond economics to include national security, technological leadership, and social cohesion in communities affected by manufacturing decline.
As global conditions continue evolving and policy interventions produce measurable results, ongoing monitoring and analysis will prove essential for businesses, investors, and policymakers navigating this complex landscape. The decisions made in the coming years will shape American economic competitiveness and security for decades to come.