Stagflation: Could the U.S. Economy Face It Again? How It Could Impact the U.S. Economy in 2026 and Beyond
The ghost of the 1970s haunts American economic policy. Stagflation remains one of the most challenging economic conditions a nation can face. Recent data from the Bureau of Labor Statistics shows troubling parallels to that turbulent period.
In early 2024, inflation persisted above the Federal Reserve’s target while GDP growth slowed to just 1.6 percent. This dangerous combination raises a critical question for millions of Americans.
Could stagflation strike the United States again in 2026? The answer matters deeply to your wallet, job security, and retirement savings. Understanding this threat helps you prepare for what economists warn could become reality.
What Is This Economic Threat?
Stagflation represents an unusual economic condition. It combines three harmful elements that typically don’t occur together. The term itself merges “stagnation” and “inflation” into one troubling word.
This phenomenon features slow economic growth alongside high inflation and high unemployment. Most economic theories suggest these conditions shouldn’t coexist. Yet history proves they absolutely can.
Historical Background of Stagflation
The 1970s introduced Americans to stagflation firsthand. Between 1973 and 1982, the U.S. economy suffered through this painful combination. Inflation reached double digits while unemployment climbed above 7 percent.
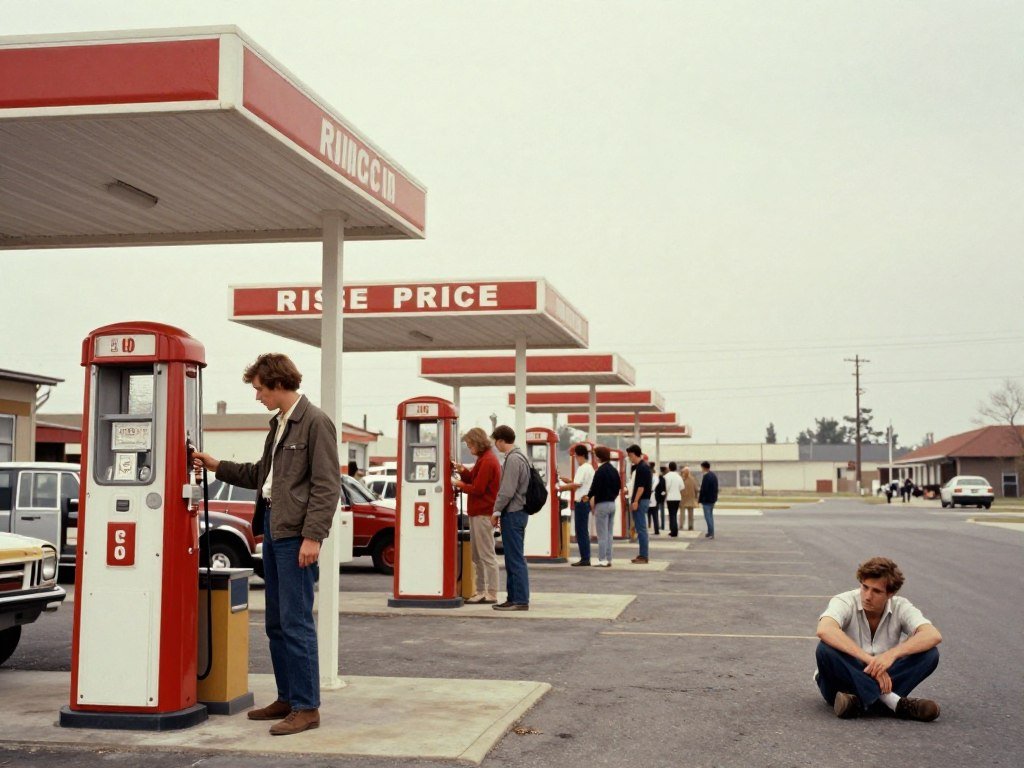
The period began with the oil crisis of 1973. The Organization of the Petroleum Exporting Countries imposed an oil embargo. Oil prices quadrupled almost overnight.
This oil shock rippled through the entire economy. Transportation costs soared. Manufacturing expenses increased dramatically. Consumers faced rising prices for virtually everything they purchased.
By 1980, inflation hit 13.5 percent annually. Unemployment reached 7.1 percent that same year. Economic growth stagnated near zero or turned negative. The combination devastated American households.
Key Statistics That Define Stagflation
Economists use specific metrics to identify stagflation. The Congressional Budget Office defines it as inflation above 5 percent combined with unemployment above 5 percent and GDP growth below 2 percent simultaneously.
During the stagflation 1970s period, these numbers told a grim story. The consumer price index increased by 110 percent over the decade. Real wages fell as prices outpaced earnings.
The misery index became a popular measure during this time. This index simply adds the inflation rate to the unemployment rate. In 1980, it peaked at 21.98 percent.
What Is Causing the Problem?
Stagflation doesn’t emerge from a single cause. Multiple factors converge to create this perfect economic storm. Understanding these drivers helps predict when conditions might develop.
Policy Factors Contributing to Stagflation
- Expansionary fiscal policy combined with loose monetary policy creates excess demand without corresponding supply increases
- Government deficit spending injects money into the economy while productive capacity remains unchanged
- Federal Reserve interest rate policies that remain too accommodative for too long fuel inflationary expectations
- Wage and price controls that distort market signals and reduce economic efficiency
- Excessive regulatory burdens that increase business costs and reduce productivity growth
The 1970s demonstrated how policy mistakes compound stagflation risks. President Nixon implemented wage and price controls in 1971. These policies temporarily suppressed inflation but created shortages.
When controls lifted, prices surged even higher. Meanwhile, the Federal Reserve kept interest rates too low. This policy fueled inflation while failing to stimulate meaningful growth.
Market Trends Driving Stagflation Risk
- Supply chain disruptions that increase costs across multiple sectors simultaneously
- Labor market tightness that drives wages higher without corresponding productivity gains
- Deglobalization trends that reduce efficiency and increase production costs
- Corporate pricing power that allows businesses to pass costs to consumers easily
- Persistent commodity price volatility affecting energy, food, and raw materials

Recent market dynamics echo the 1970s in concerning ways. Supply chain bottlenecks persisted through 2023 and 2024. Semiconductor shortages limited manufacturing capacity.
The labor market showed unusual patterns. Unemployment remained low while labor force participation lagged. This mismatch created wage pressures without full economic recovery.
Global Influences on Stagflation
- Energy price shocks from geopolitical tensions or production cuts by oil-producing nations
- International trade conflicts and tariff policies that increase import costs
- Currency devaluation that makes imported goods more expensive
- Global pandemic effects that simultaneously disrupt supply and demand
- Climate-related disruptions affecting agricultural production and commodity supplies
The oil crisis remains the classic global stagflation trigger. In 2022, energy prices spiked following geopolitical events. Oil reached $120 per barrel before moderating.
These price increases flowed through the economy rapidly. Transportation costs increased. Heating and cooling expenses rose. Manufacturers faced higher energy bills that translated into rising prices for goods.
Structural Economic Changes
- Declining productivity growth that limits the economy’s capacity to expand without inflation
- Demographic shifts including aging populations that reduce labor force growth
- Technology disruption that displaces workers faster than new jobs emerge
- Debt accumulation that constrains government policy responses
- Healthcare cost inflation that consumes growing portions of economic output
Structural factors create long-term stagflation vulnerability. U.S. productivity growth averaged just 1.4 percent annually from 2010 to 2020. This rate falls well below historical norms.
Lower productivity growth means the economy cannot expand as quickly without generating inflation. Workers produce less additional output per hour worked. This dynamic limits sustainable economic growth rates.
Impact on the U.S. Economy
Stagflation inflicts damage across every economic sector. Its effects compound over time as high inflation and slow growth reinforce each other. Americans feel the pain through multiple channels simultaneously.
GDP Growth Under Stagflation
Economic growth grinds to a halt during stagflation periods. The 1970s saw multiple quarters of negative growth despite persistent inflation. Real GDP growth averaged just 2.4 percent annually during that decade.
This slow growth creates a vicious cycle. Businesses hesitate to invest when the economic outlook appears uncertain. Consumers reduce spending as their purchasing power erodes. Reduced investment and consumption further depress growth.
The Congressional Budget Office projects potential complications ahead. If stagflation develops in 2026, GDP growth could fall below 1 percent annually. Some economists warn growth might turn negative while inflation persists.
Such conditions would represent a significant economic contraction. The U.S. economy hasn’t experienced sustained stagflation since the early 1980s. Modern policymakers lack recent experience managing this challenge.
Inflation Dynamics
High inflation forms the core of stagflation’s threat. Prices rise across broad categories of goods and services. The Bureau of Labor Statistics tracks this through the consumer price index.
During the 1970s, inflation exceeded 5 percent in eight of ten years. It peaked above 13 percent in 1980. These rising prices devastated household budgets and savings.
Inflation erodes purchasing power rapidly. A dollar in 1970 had the purchasing power of just $0.31 by 1980. Families watched their savings lose value even as their incomes struggled to keep pace.
Energy and food prices typically lead inflationary surges. The oil crisis drove gasoline prices up 300 percent in the 1970s. Food costs increased nearly as dramatically. These essential expenses consumed larger portions of household budgets.
Employment Challenges
High unemployment characterizes stagflation alongside inflation. This combination creates particular hardship. Job losses mount even as prices for basic necessities increase.
Unemployment reached 7.5 percent during the 1970s stagflation period. By 1982, it peaked at 10.8 percent. Millions of Americans lost jobs during this time.
The employment picture becomes especially difficult because traditional solutions fail. The Federal Reserve typically cuts interest rates during recessions to spur job creation. But high inflation prevents this response.
Raising rates to combat inflation typically increases unemployment further. Policymakers face an impossible choice. Fighting inflation requires policies that cost jobs. Supporting employment risks worsening inflation.
Financial Markets Volatility
Stagflation punishes investment portfolios severely. Stock markets struggle when economic growth stalls. Bond markets suffer when inflation rises. Both conditions occurring together leave few safe havens.
The stock market delivered negative real returns during much of the 1970s. The Dow Jones Industrial Average ended the decade barely above where it started. Adjusted for inflation, investors lost significant wealth.
Bond investors fared even worse. Rising inflation destroyed bond values. A bond purchased in 1970 lost substantial purchasing power by 1980. Interest rate increases further depressed bond prices.
Real estate showed mixed performance. Property values generally kept pace with inflation. However, extremely high interest rates made purchasing homes difficult. Mortgage rates exceeded 18 percent by 1981.
Consumer and Business Effects
Households face crushing pressure during stagflation periods. Rising prices reduce living standards. Job insecurity increases financial stress. The combination creates widespread economic anxiety.
Consumer confidence plummets during these times. People delay major purchases. They reduce discretionary spending. This behavior further weakens economic growth.
Businesses struggle with multiple challenges simultaneously. Input costs increase due to inflation. Revenue growth slows as the economy stagnates. Profit margins compress from both directions.
Investment decisions become nearly impossible. High inflation makes long-term planning difficult. Slow growth reduces returns on capital investment. Many businesses simply postpone expansion plans.
Small businesses suffer disproportionately. They lack pricing power to pass costs to customers. They cannot absorb losses as easily as larger competitors. Many small businesses fail during prolonged stagflation.
Recent Data and Trends
Current economic indicators reveal concerning patterns. The Bureau of Labor Statistics and Federal Reserve data show conditions that merit careful monitoring. Several metrics suggest elevated stagflation risk for 2026.
Latest Inflation Statistics
Inflation has proven more persistent than economists initially predicted. The consumer price index increased 3.4 percent year-over-year as of December 2023. This rate remains well above the Federal Reserve’s 2 percent target.
Core inflation excluding food and energy shows similar persistence. This measure stood at 3.9 percent in late 2023. Core inflation matters because it reflects underlying price pressures beyond volatile commodity categories.
Certain categories show particularly troubling increases. Housing costs rose 6.2 percent annually in 2023. Food prices increased 5.8 percent. These essential expenses consume large portions of household budgets.
Services inflation remains especially stubborn. Healthcare costs continue rising faster than overall inflation. Education expenses show similar patterns. These price increases prove difficult to reverse.
Employment and Wage Trends
The labor market presents a mixed picture. Unemployment remained historically low at 3.7 percent in late 2023. However, labor force participation has not fully recovered to pre-pandemic levels.
Wage growth shows concerning dynamics. Average hourly earnings increased 4.1 percent year-over-year in 2023. This growth outpaces the Federal Reserve’s target but lags inflation in many periods.
The result creates real wage stagnation. Workers receive higher nominal pay but reduced purchasing power. This dynamic characterized the stagflation 1970s period as well.
Job openings remain elevated but have declined from peaks. The Bureau of Labor Statistics reported 8.7 million openings in late 2023. This figure suggests some labor market cooling without dramatic weakening.
Economic Growth Indicators
GDP growth has decelerated significantly. The economy expanded just 1.6 percent in the first quarter of 2024. This rate falls well below the long-term average of approximately 3 percent annually.
Consumer spending growth has moderated substantially. Personal consumption expenditures increased 2.5 percent in early 2024. This slowdown reflects reduced purchasing power and increased economic uncertainty.
Business investment shows similar weakness. Equipment spending declined in several recent quarters. Commercial construction activity has slowed. These trends suggest businesses anticipate weaker demand ahead.
The Congressional Budget Office projects GDP growth of just 1.5 percent for 2024 overall. Looking toward 2026, projections range from 1.8 to 2.3 percent. These rates barely exceed population growth.
Government and Institutional Sources
Multiple authoritative sources track these trends. The U.S. Department of the Treasury publishes regular economic outlooks. Their March 2024 report highlighted persistent inflation concerns.
The International Monetary Fund issued warnings about global stagflation risks. Their October 2023 World Economic Outlook noted that advanced economies face “unprecedented uncertainty” about growth and inflation dynamics.
The World Bank echoed these concerns. Their 2024 Global Economic Prospects report warned that a combination of high debt, slow growth, and inflation creates “a potential perfect storm” for stagflation.
Federal Reserve officials have acknowledged the challenge. Chairman Jerome Powell stated in congressional testimony that achieving a “soft landing” with low inflation and continued employment growth represents the narrowest path in decades.
Expert Opinions or Forecasts
Leading economists express divergent views about stagflation risk. Their projections range from optimistic scenarios to dire warnings. Understanding this spectrum helps gauge potential outcomes for 2026 and beyond.
Economist Projections for 2026
Former Treasury Secretary Lawrence Summers has warned repeatedly about stagflation dangers. He argues that current policy settings risk recreating conditions similar to the 1970s. His forecast suggests elevated inflation persisting through 2026.
Mohamed El-Erian, chief economic advisor at Allianz, shares these concerns. He coined the term “stagflationary environment” to describe current conditions. El-Erian predicts growth averaging just 1 percent with inflation near 4 percent through 2026.
Other economists present more optimistic outlooks. Mark Zandi of Moody’s Analytics expects inflation to moderate to 2.5 percent by late 2025. He projects GDP growth recovering to 2.2 percent in 2026.
The Federal Reserve’s own projections show measured optimism. Their Summary of Economic Projections from December 2023 forecasts inflation declining to 2.4 percent by end of 2025. They project GDP growth of 1.8 percent for 2026.
Market Outlook and Investor Sentiment
Financial markets price in significant uncertainty about the economic path ahead. Bond markets show inverted yield curves. This pattern historically precedes recessions.
Investment strategists at major banks express caution. Goldman Sachs places 35 percent probability on stagflation developing by 2026. JPMorgan estimates similar odds at 30 percent.
Commodity markets signal ongoing inflation concerns. Gold prices remain elevated near all-time highs. Oil prices show volatility around $80 per barrel. These patterns suggest investors hedge against inflation persistence.
Stock market valuations reflect mixed expectations. Technology stocks remain relatively strong, suggesting growth optimism in some sectors. Value stocks and financials lag, indicating concern about broader economic weakness.
Risk Level Assessment
Based on comprehensive analysis of current data and expert forecasts, the stagflation risk level for 2026 rates as MEDIUM to MEDIUM-HIGH.
Several factors support this assessment. Inflation has proven more persistent than expected. Economic growth continues decelerating. Policy options remain constrained by high government debt levels.
The Organization for Economic Cooperation and Development rates U.S. stagflation risk at approximately 40 percent for the 2025-2027 period. This probability represents significant concern without suggesting inevitability.
Factors Increasing Risk
- Persistent services inflation above 4 percent
- Geopolitical tensions affecting energy supplies
- Tight labor markets maintaining wage pressure
- High government debt limiting fiscal response
- Deglobalization increasing production costs
- Climate-related supply disruptions
Factors Reducing Risk
- Federal Reserve commitment to price stability
- Improving supply chain conditions
- Technology driving productivity gains
- Energy production capacity expansions
- Labor force participation gradually recovering
- Corporate profit margins providing inflation buffer
The balance of these factors suggests stagflation remains a serious possibility rather than a certainty. Much depends on policy decisions made in 2024 and 2025. The Federal Reserve’s interest rate path will prove crucial.
Geopolitical developments could tip the balance significantly. Another major oil crisis would dramatically increase stagflation probability. Conversely, breakthrough productivity improvements from artificial intelligence could reduce risks.
Possible Solutions or Policy Responses
Combating stagflation requires coordinated policy responses across multiple fronts. No single solution exists. Policymakers must balance competing objectives carefully. Historical experience and modern economic theory suggest several potential approaches.
Government Actions to Address Stagflation
Fiscal policy plays a critical role in stagflation prevention and response. The U.S. Department of the Treasury must pursue policies that enhance productive capacity without fueling additional inflation.
Supply-side reforms offer the most promising approach. These policies aim to increase economic output without corresponding demand increases. This balance helps reduce inflation while supporting growth.
- Tax reforms that incentivize business investment in productive assets and technology
- Regulatory streamlining to reduce costs and improve efficiency across industries
- Infrastructure investment focused on removing bottlenecks and increasing capacity
- Trade policies that reduce tariffs and expand access to international markets
- Immigration reforms to address labor shortages in critical sectors
- Energy policy that increases domestic production and reduces price volatility
Government spending discipline becomes essential during stagflation threats. The Congressional Budget Office projects federal deficits exceeding $1 trillion annually through 2030. This debt accumulation constrains future policy options.
Targeted spending cuts that don’t harm productive capacity help reduce inflationary pressure. Eliminating wasteful programs frees resources for more efficient private sector use. This approach requires difficult political choices.
Federal Reserve Policies
Monetary policy bears primary responsibility for controlling inflation. The Federal Reserve faces the challenging task of reducing price increases without triggering severe recession.
Interest rate policy represents the Fed’s primary tool. Higher rates slow economic activity and reduce inflation. However, this medicine carries significant side effects during stagflation.
The Federal Reserve learned critical lessons from the 1970s experience. Then-Chairman Paul Volcker raised interest rates dramatically in the early 1980s. The federal funds rate peaked above 19 percent.
These aggressive rate increases successfully broke inflation. However, they also caused severe recession. Unemployment exceeded 10 percent. The economy contracted sharply before recovering.
Modern Federal Reserve policy aims for more gradual approach. Current Chairman Powell has raised rates methodically since 2022. The federal funds rate reached 5.25-5.50 percent by mid-2023.
- Continue data-dependent interest rate adjustments based on inflation and employment trends
- Maintain restrictive monetary policy until inflation clearly returns to target
- Avoid premature rate cuts that could reignite inflation
- Communicate policy intentions clearly to anchor inflation expectations
- Use balance sheet reduction to remove monetary accommodation
- Coordinate with fiscal authorities to ensure policy consistency
The Federal Reserve must maintain credibility in its inflation-fighting commitment. Markets and consumers form expectations based on central bank actions. If people believe inflation will persist, those expectations become self-fulfilling.
Market Adjustments and Private Sector Responses
Markets naturally adjust to stagflation conditions over time. These adjustments help rebalance supply and demand. However, the transition period often proves painful for businesses and workers.
Wage and price adjustments eventually bring inflation under control. If policymakers allow markets to function, high prices encourage increased supply. High wages attract workers to productive sectors.
Business investment patterns shift during stagflation periods. Companies focus on efficiency improvements and cost reduction. Technology adoption accelerates as firms seek productivity gains.
- Productivity enhancements through automation and technology adoption
- Supply chain diversification to reduce vulnerability to disruptions
- Pricing strategies that balance revenue needs with competitive pressures
- Labor force development and skills training to address worker shortages
- Energy efficiency investments to reduce exposure to commodity price swings
- Capital allocation favoring projects with quick returns over long-term bets
Consumer behavior adapts to persistent inflation as well. Households shift spending toward necessities and away from discretionary purchases. Savings rates may increase as people prepare for uncertain times.
These market adjustments ultimately help resolve stagflation. However, the process takes years rather than months. Policy support can accelerate beneficial adjustments while cushioning negative impacts.
What It Means for Americans
Stagflation affects everyday Americans through multiple channels. Understanding these impacts helps families prepare and adapt. The combination of rising prices and economic stagnation creates challenges for households across all income levels.
Cost of Living Impacts
Rising prices erode purchasing power dramatically during stagflation. Essential expenses consume larger portions of household budgets. Families must make difficult choices about spending priorities.
Food costs increase significantly during inflationary periods. The Bureau of Labor Statistics data shows groceries rising 5-6 percent annually in recent years. A stagflation scenario could push food inflation to 8-10 percent or higher.
A family spending $800 monthly on groceries would face an additional $64-80 per month in costs. Over a year, this amounts to $768-960 in reduced purchasing power just for food.
Energy expenses follow similar patterns. Gasoline prices often lead inflation surges. Heating and cooling costs increase substantially. These expenses hit lower-income households especially hard.
Housing represents the largest expense for most families. Rent increases typically accelerate during inflation. Homeowners face higher property taxes and maintenance costs. Insurance premiums rise across categories.
Healthcare costs continue their relentless increase. Medical expenses often outpace general inflation even during normal times. Stagflation compounds this pressure through reduced insurance coverage and higher out-of-pocket costs.
Employment and Income Effects
Job security deteriorates during stagflation periods. Companies reduce hiring and accelerate layoffs. Unemployment rises even as prices increase. This combination creates severe household stress.
Workers face reduced bargaining power despite labor shortages in some sectors. Businesses cannot afford wage increases that keep pace with inflation. Real wages decline as nominal pay raises lag price increases.
The 1970s showed this dynamic clearly. Average weekly earnings increased nominally but fell in real terms. Workers earned more dollars but could purchase less with those dollars.
Career advancement opportunities diminish during slow growth periods. Promotions become scarce. Job switching for higher pay grows more difficult. Many workers feel trapped in positions with stagnant compensation.
Young workers entering the labor market face particular challenges. Entry-level positions disappear. Wage growth for new hires lags experienced workers. Starting careers during stagflation creates lasting income effects.
Investment and Retirement Impacts
Retirement savings suffer tremendously during stagflation. Stock markets typically deliver poor returns when growth stagnates. Bond portfolios lose value as inflation rises. Traditional diversification strategies fail.
A balanced portfolio of 60 percent stocks and 40 percent bonds lost ground during the 1970s. Inflation-adjusted returns turned negative for the decade. Retirees saw their nest eggs shrink in purchasing power terms.
Social Security Administration benefits adjust for inflation through cost-of-living adjustments. However, these adjustments often lag actual price increases. Retirees find their benefits purchase less over time.
Defined benefit pension plans face severe stress during stagflation. Investment returns fall while benefit obligations grow with inflation. Many pension funds become underfunded. Benefit cuts sometimes result.
Young savers face the challenge of contributing to retirement accounts while current living costs surge. Many reduce retirement contributions to cover immediate expenses. This choice compromises long-term financial security.
Housing Market Dynamics
Real estate markets show complex responses to stagflation. Property values often keep pace with inflation, protecting homeowner equity. However, transaction volumes typically collapse.
High interest rates make purchasing homes extremely difficult. Mortgage rates exceeded 18 percent in the early 1980s. Even qualified buyers cannot afford payments at such rates.
The rental market faces contradictory pressures. Demand increases as fewer people can purchase homes. However, landlords struggle with higher operating costs while tenant incomes stagnate.
Home maintenance becomes more expensive during stagflation. Construction materials increase in price. Contractor labor costs rise. Homeowners defer maintenance, potentially affecting long-term property values.
First-time homebuyers find the market particularly challenging. Down payment requirements increase. Qualifying for mortgages becomes harder. The dream of homeownership recedes for many younger Americans.
Future Outlook (2026–2030)
The economic landscape through the remainder of the decade remains highly uncertain. Multiple scenarios exist depending on policy choices and external developments. Examining potential paths helps Americans prepare appropriately.
Short-Term Outlook for 2026-2027
The immediate future presents significant challenges. Economic data suggests 2026 will prove a critical inflection point. Current policy trajectories and structural conditions create elevated stagflation risk.
The International Monetary Fund forecasts U.S. GDP growth of 1.8-2.2 percent for 2026. This rate barely exceeds population growth. Per capita income would expand minimally under this scenario.
Inflation projections for 2026 range widely among economists. Optimistic forecasts see inflation declining to 2.5 percent. Pessimistic scenarios suggest inflation remaining near 4 percent or potentially increasing.
The Federal Reserve’s policy stance will largely determine which scenario materializes. Continued restrictive monetary policy through 2025 could bring inflation under control. However, this approach risks recession.
Alternatively, premature interest rate cuts could reignite inflation while failing to significantly boost growth. This path most closely resembles the stagflation scenario.
Employment trends suggest a gradual labor market softening through 2026. Unemployment may rise from current 3.7 percent to 4.5-5.0 percent. This increase would still represent relatively healthy labor market conditions historically.
However, combining 5 percent unemployment with 4 percent inflation and 1.8 percent growth creates textbook stagflation conditions. The economy would feel substantially weaker than recent years.
Medium-Term Risks Through 2028
The 2027-2028 period presents additional complications. Several structural factors could intensify stagflation pressures or create opportunities for recovery.
Demographic trends work against economic growth. Baby boomer retirements accelerate through this period. Labor force growth slows significantly. These dynamics reduce the economy’s potential growth rate.
The Congressional Budget Office estimates potential GDP growth of just 1.8 percent annually through 2030. This rate reflects demographic headwinds and modest productivity assumptions.
Government debt levels become increasingly constraining. Federal debt held by the public could exceed 110 percent of GDP by 2028. Interest costs consume growing portions of the federal budget.
This debt burden limits fiscal policy flexibility. Traditional stimulus options become less viable. Policymakers face difficult choices between debt sustainability and economic support.
- Social Security and Medicare costs increasing as baby boomers retire
- Defense spending pressures from geopolitical tensions
- Infrastructure maintenance requirements reaching critical levels
- Climate adaptation costs increasing across regions
- Interest expense on existing debt rising with higher rates
Technology presents both opportunities and risks during this period. Artificial intelligence and automation could drive significant productivity gains. These improvements would help alleviate stagflation pressures.
However, rapid technological change also creates workforce disruptions. Displaced workers require retraining and support. This transition costs money and creates temporary economic drag.
Long-Term Outlook Through 2030
Looking toward decade’s end, several potential outcomes emerge. The most optimistic scenario sees technological breakthroughs driving renewed productivity growth. This path would support 2.5-3.0 percent GDP growth with inflation near 2 percent.
This optimistic case requires several factors aligning favorably. Energy prices must remain moderate. Geopolitical tensions must not escalate. Policy must support innovation and investment.
The middle scenario represents muddling through. Growth averages 2.0 percent with inflation fluctuating between 2.5-3.5 percent. This path avoids severe stagflation but delivers mediocre results.
Under this scenario, living standards improve slowly. Real wage growth remains minimal. Wealth inequality likely increases as asset owners outperform wage earners.
The pessimistic scenario involves entrenched stagflation. Growth falls below 1.5 percent while inflation persists above 4 percent. Unemployment averages 5.5-6.5 percent. This outcome would represent the worst economic performance since the 1970s.
Several trigger events could push outcomes toward the pessimistic scenario. A major geopolitical crisis affecting energy supplies represents the most obvious risk. Another pandemic would create similar pressures.
Financial system stress could also trigger stagflation. High debt levels create vulnerabilities. Banking sector problems or sovereign debt crises could force policy responses that fuel inflation while depressing growth.
Climate change presents increasing economic risks through 2030. More frequent extreme weather disrupts supply chains. Agricultural production faces growing uncertainty. Adaptation costs increase across sectors.
The World Bank estimates climate-related costs could reduce GDP by 1-2 percentage points annually in some scenarios. These effects would compound other stagflation pressures.
Key Indicators to Monitor
- Core inflation trends excluding volatile components
- Real wage growth adjusted for inflation
- Labor force participation rates
- Total factor productivity growth
- Federal deficit and debt trajectories
- Energy price volatility
Americans should track these indicators regularly through 2026 and beyond. Significant deterioration in multiple measures would signal increasing stagflation probability.
Conversely, improvement across several metrics would suggest economy avoiding worst outcomes. The Bureau of Labor Statistics and Federal Reserve publish these data monthly.
Preparation matters more than prediction. Households cannot control macroeconomic outcomes. However, informed financial planning helps families navigate whatever scenario develops.
Conclusion
Stagflation represents a serious economic threat that Americans cannot afford to ignore. The combination of high inflation, high unemployment, and slow growth creates challenges for households, businesses, and policymakers alike.
Historical experience from the 1970s demonstrates the pain stagflation inflicts. Purchasing power erodes rapidly. Job security diminishes. Investment returns disappoint. The effects compound over years.

Current economic conditions show troubling similarities to that earlier period. Inflation persists above target levels. Economic growth has decelerated significantly. Policy options face constraints from high government debt.
The risk level for stagflation developing in 2026 rates as medium to medium-high. Approximately 35-40 percent probability suggests meaningful concern without implying inevitability. Much depends on decisions made over the next 18-24 months.
Federal Reserve policy will prove crucial. Maintaining restrictive monetary policy long enough to control inflation requires political courage. Premature rate cuts risk recreating 1970s mistakes.
Fiscal policy must support productive capacity without fueling additional inflation. Supply-side reforms offer the most promising path. Infrastructure investment, regulatory streamlining, and trade expansion all help.
Americans should take practical steps to protect themselves regardless of which scenario materializes. Building emergency savings provides buffer against job loss. Diversifying investments across asset classes reduces portfolio risk.
Skills development and career adaptability help maintain employment during economic turbulence. Healthcare and essential expenses warrant particular attention in household budgets.
The period from 2026 through 2030 will test American economic resilience. Challenges exist across multiple dimensions. However, informed preparation and sound policy choices can help navigate these difficulties successfully.
Staying informed about economic developments remains essential. Monitor key indicators from the Bureau of Labor Statistics, Federal Reserve, and Congressional Budget Office. Adjust plans as conditions evolve.
The United States successfully overcame stagflation in the 1980s. Modern policymakers possess better tools and understanding than their predecessors. With determination and wise choices, Americans can avoid or minimize stagflation impacts in the years ahead.